Canva Tool Suite
Create Better Designs without learning a lot of skills


Testimonials & Reviews
Hear From Our Happy Clients: Their Stories

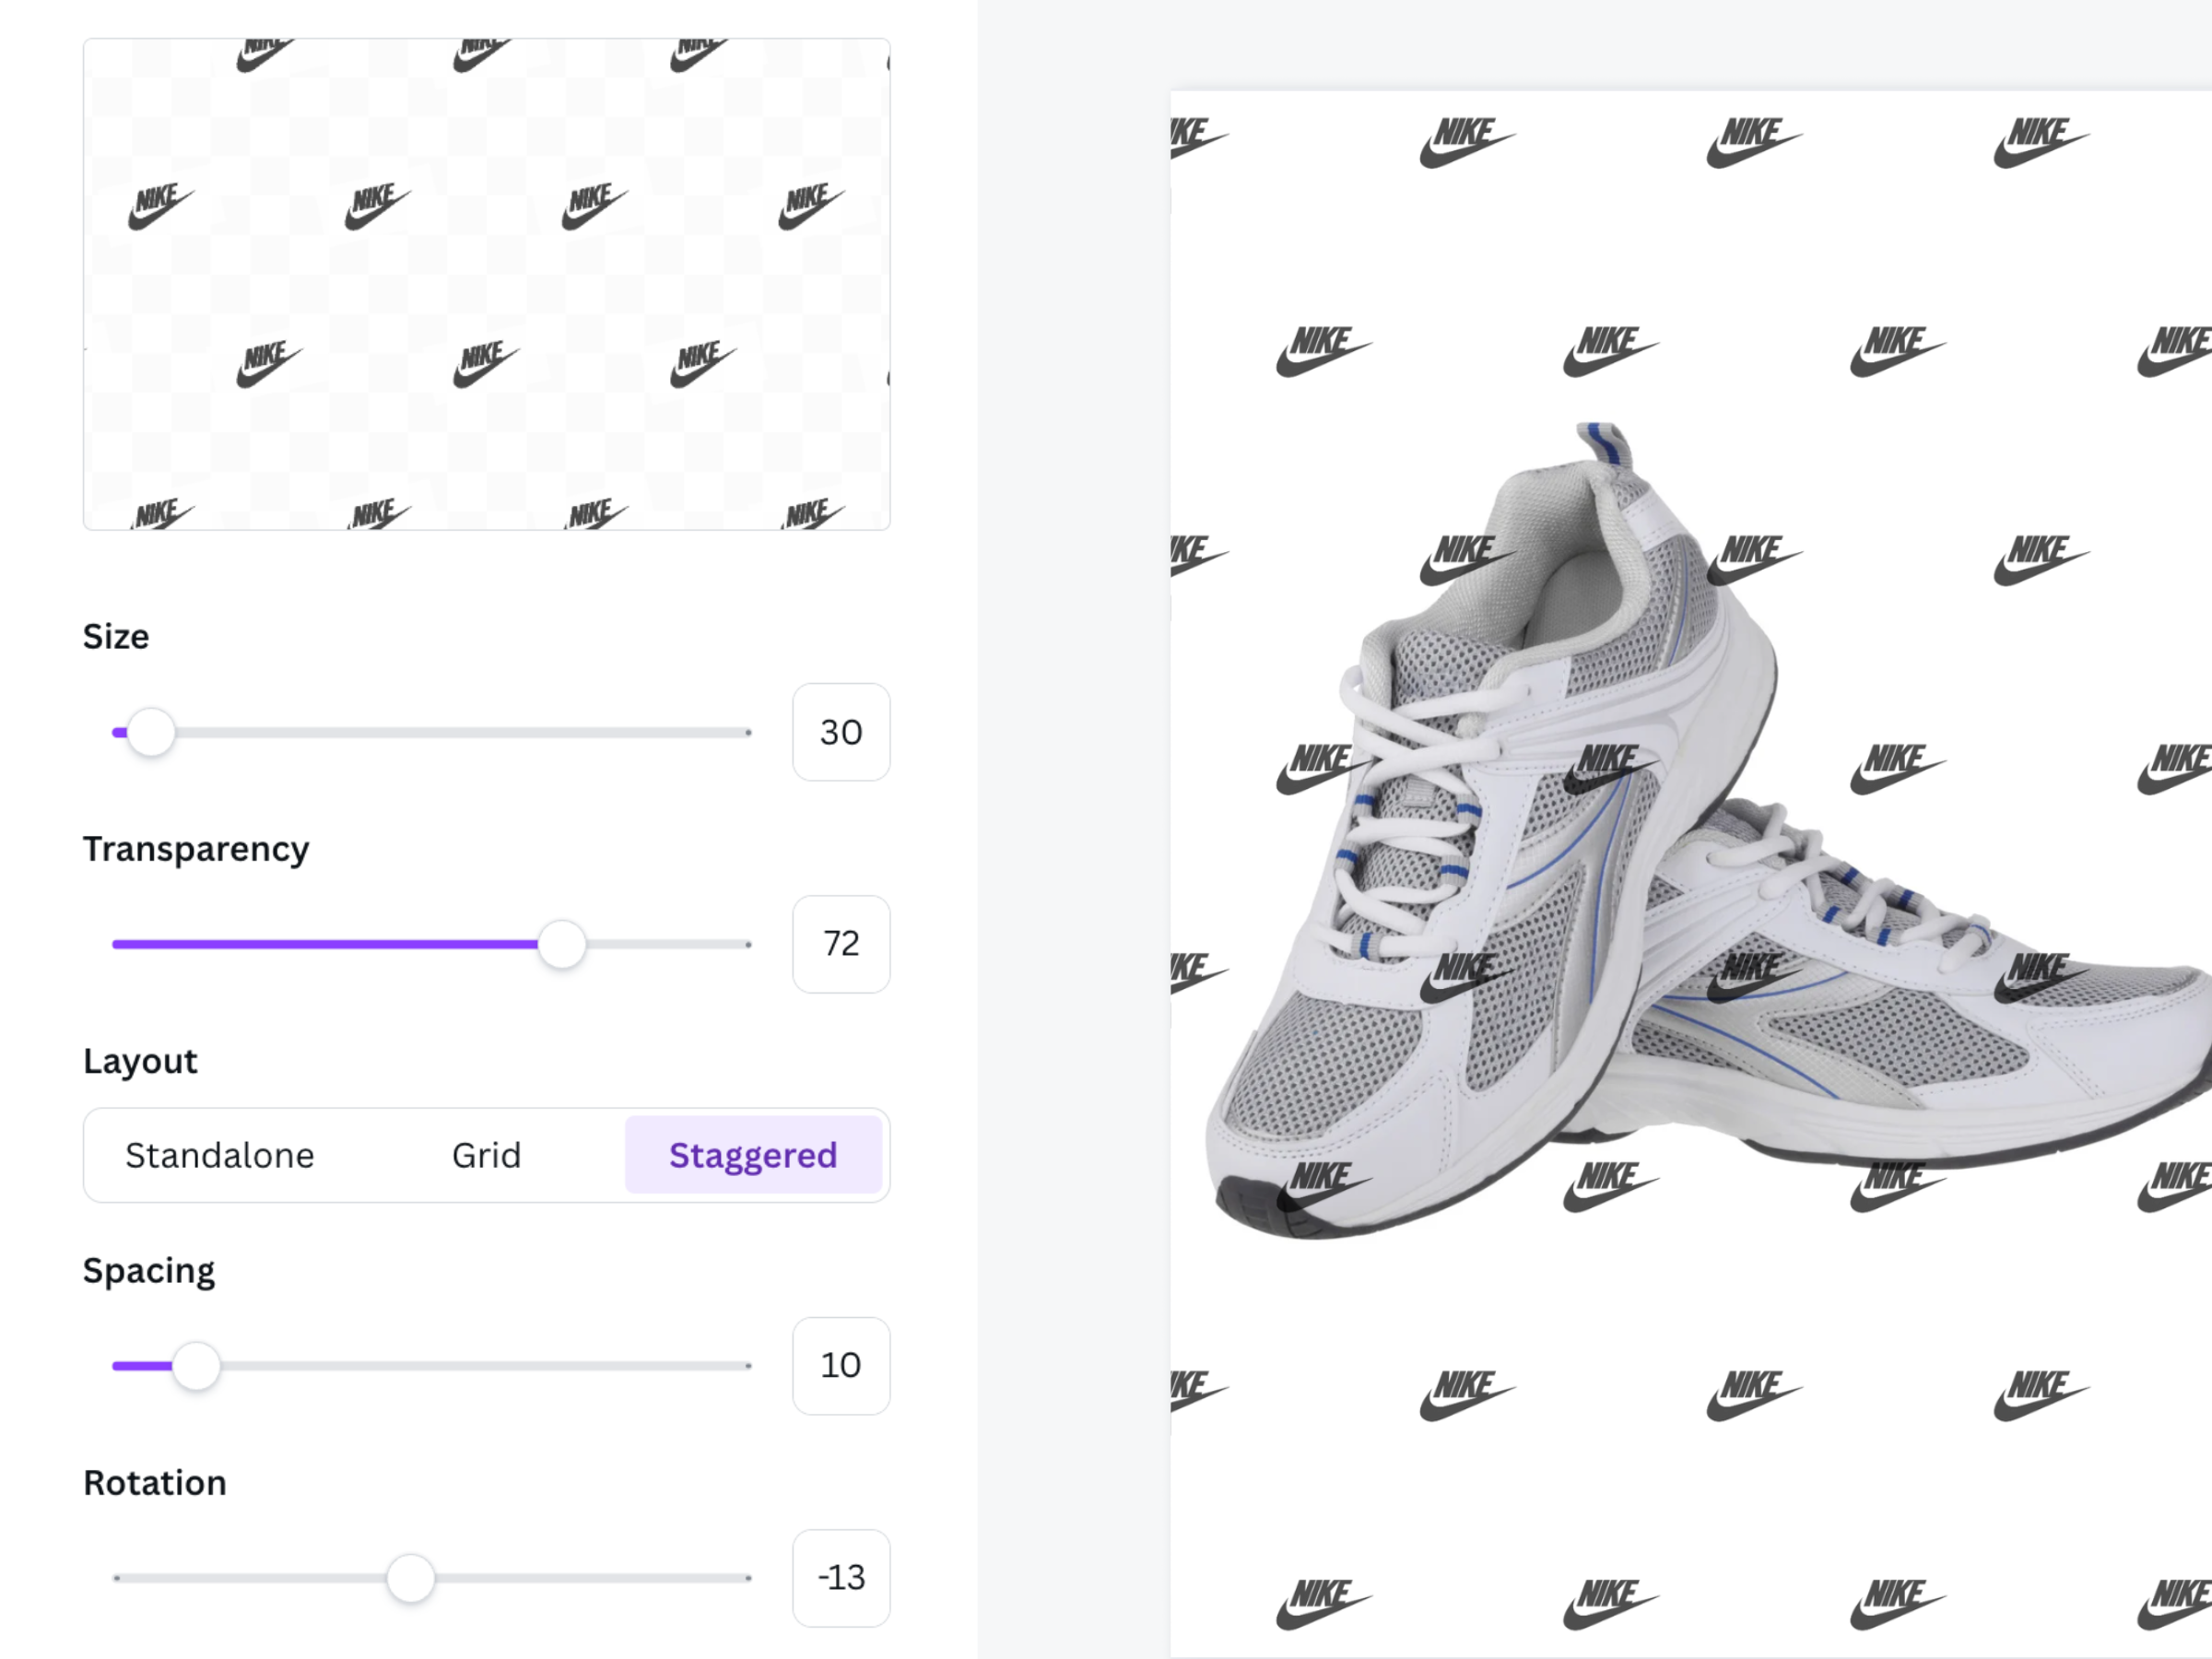
The Pictogram Maker has been a game-changer for our team. It allows me to easily create personalized and thematic pictorial charts for our infographics. I can upload icons, choose a style, and quickly visualize data in a clear and engaging way. It’s a huge time-saver!

Sarah Johnson
Marketing Manager

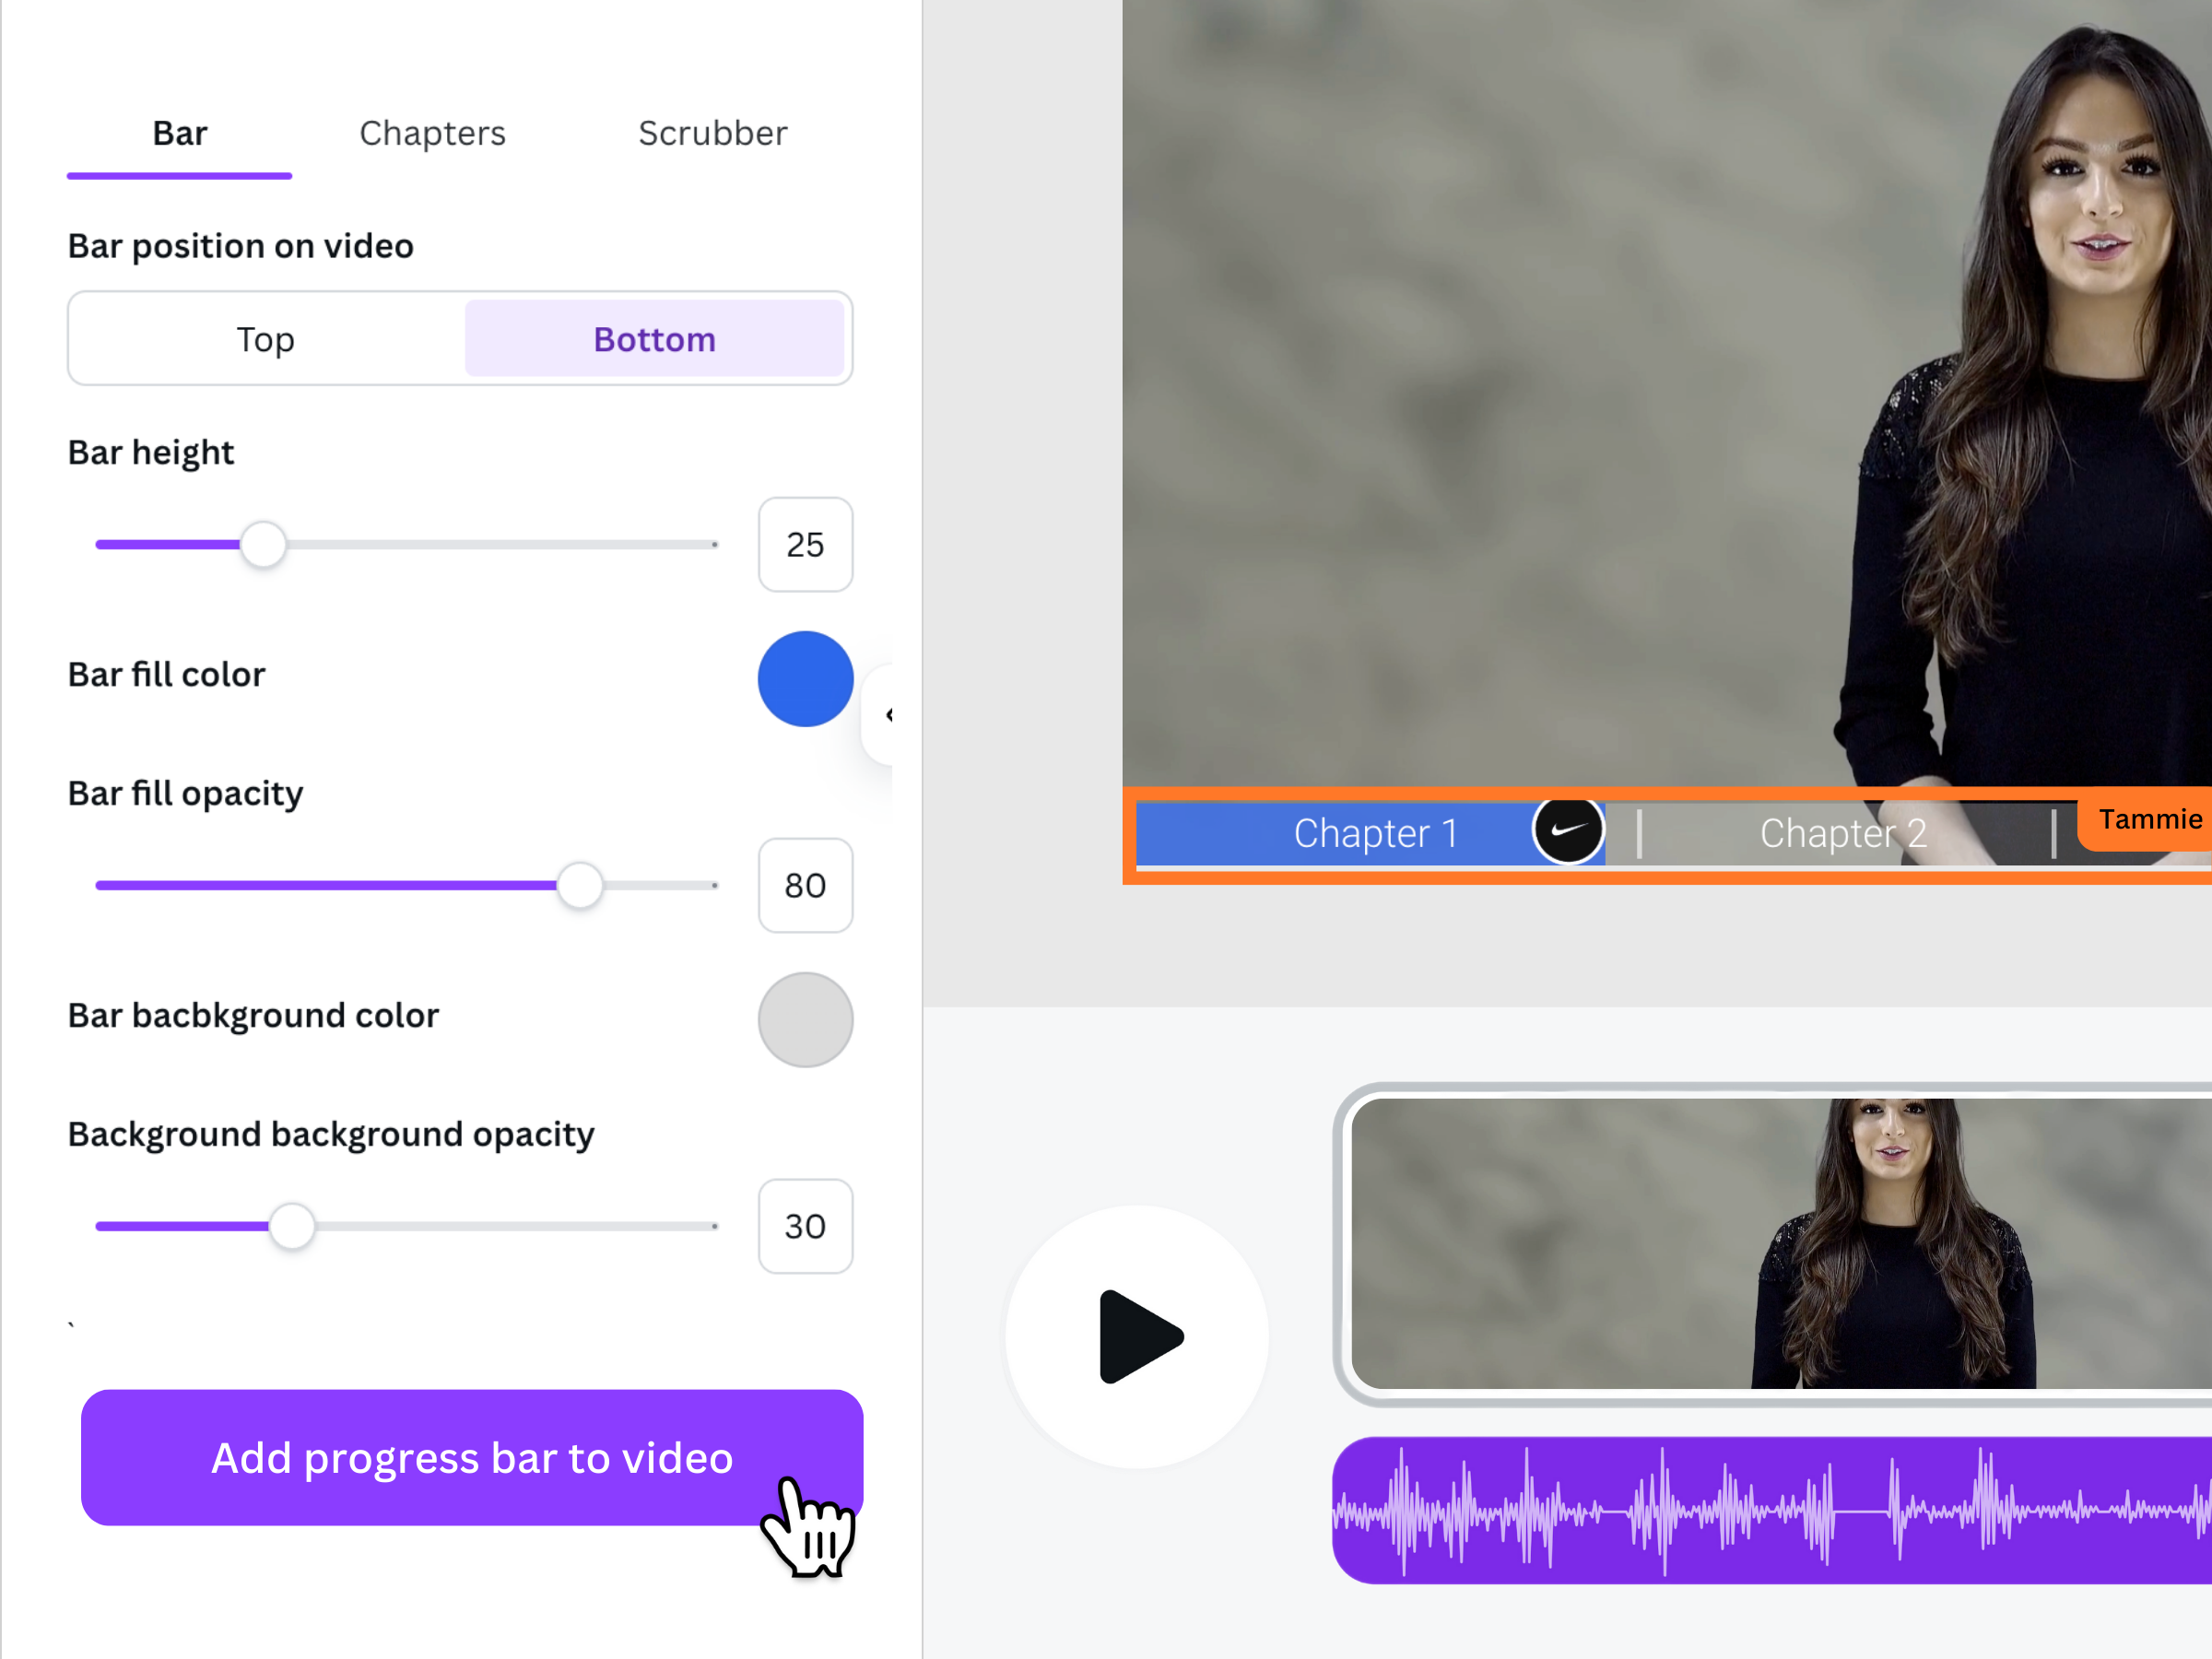
I love using the Progress Bar Maker for my videos. The AI tool analyzes my content and generates progress bars that I can customize easily. It makes my videos look more professional, and the eye-catching bars really help keep my viewers engaged throughout.

Emily Thompson
Video Content Creator

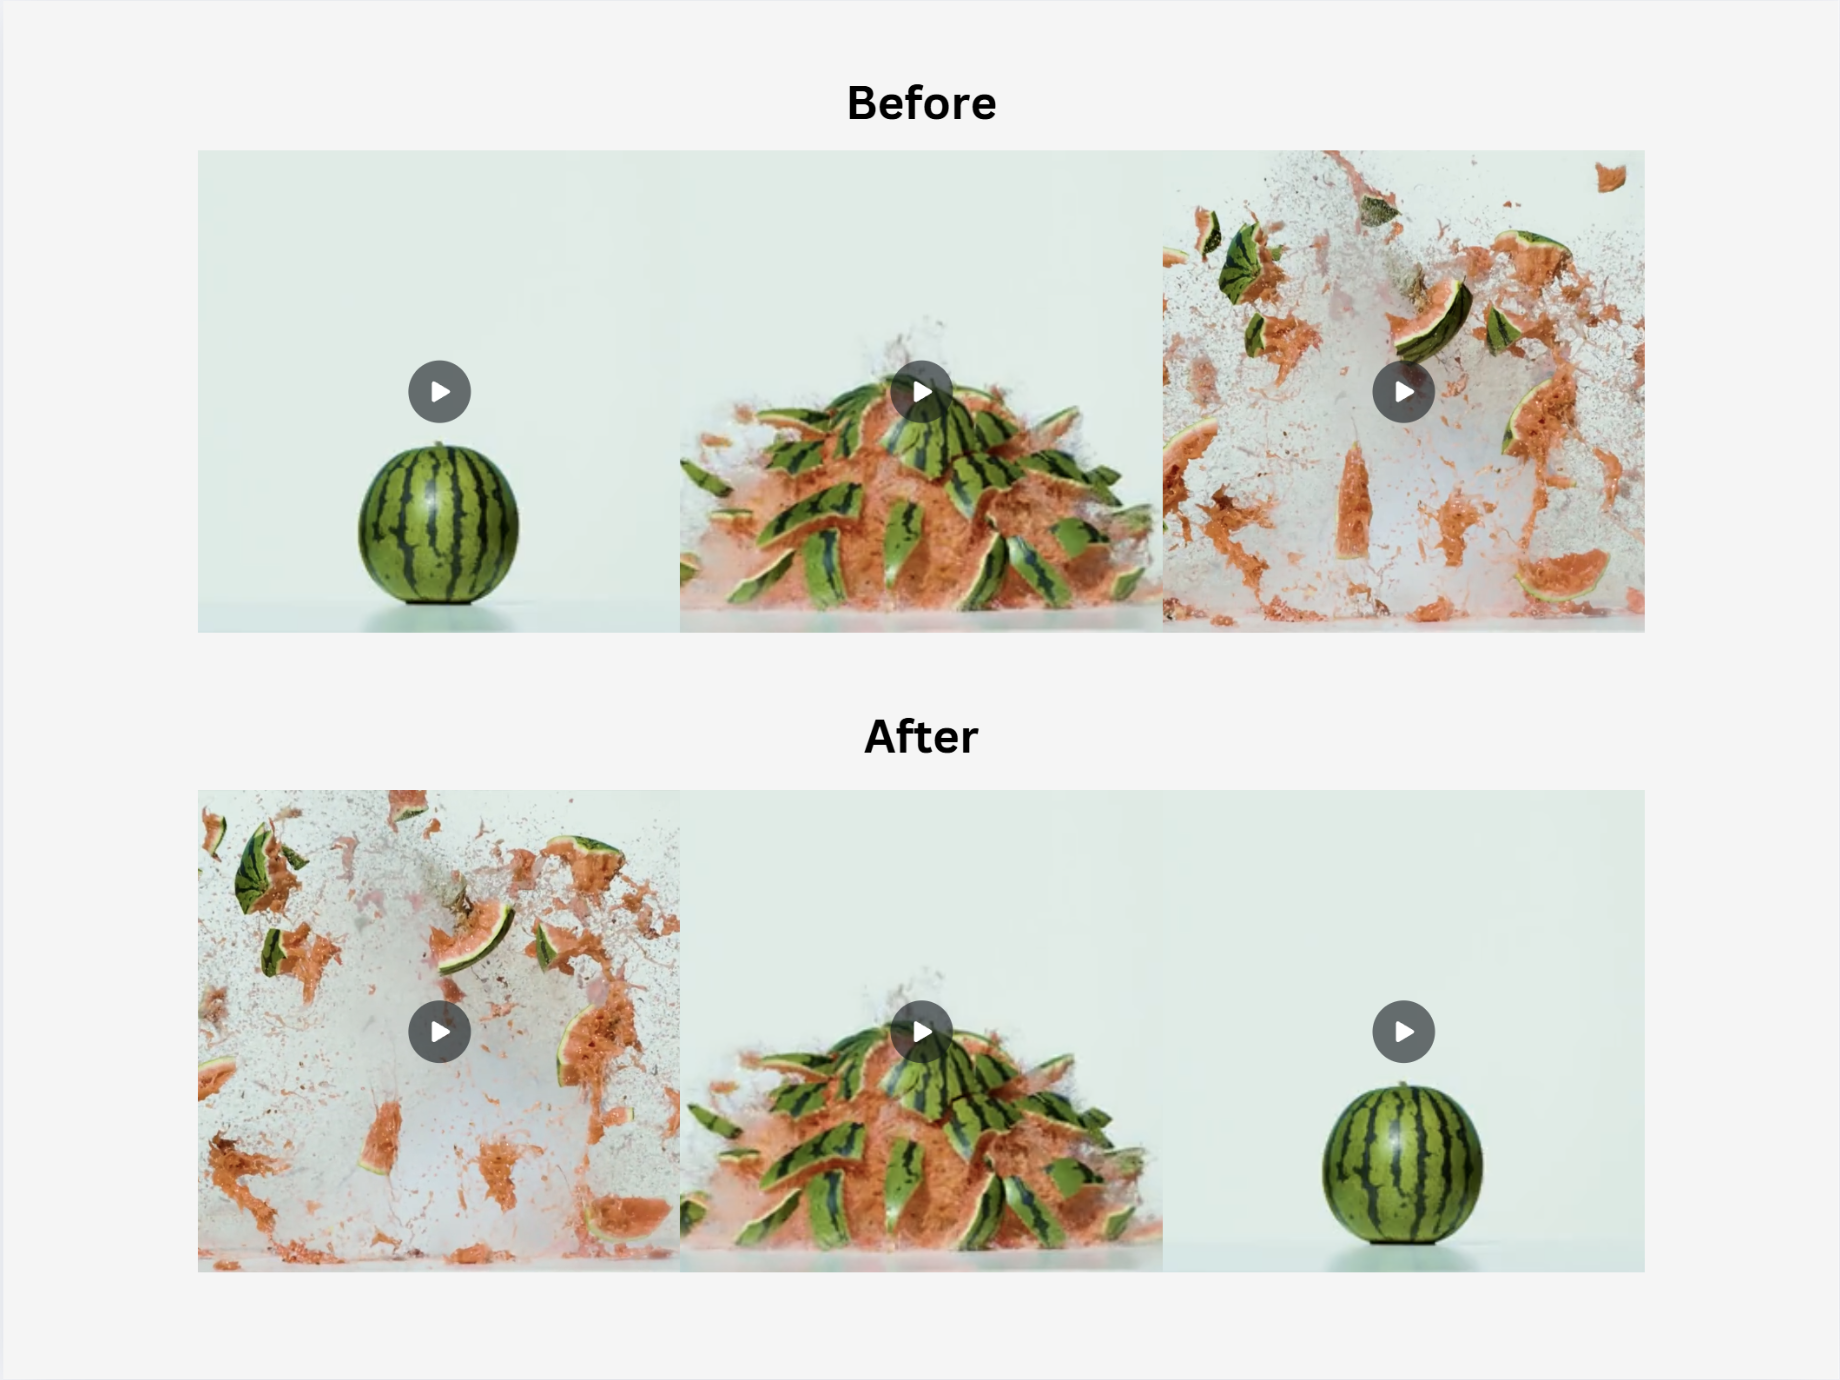
The Video Reverser is perfect for adding fun effects to my videos. It lets me reverse clips, adjust playback speed, and control the audio, which makes my content stand out. Whether I want to keep the original sound or mute it, it’s a great tool for creating engaging videos.

James Carter
Social Media Manager
Brands We’ve Collaborated With


Boost Your Design Today!
If you have any feedback, questions, or need support, feel free to reach out to us anytime.

